



What Really Drives Outcomes: Why key driver analysis needs more than one method
Discover why key driver analysis needs more than regression alone—and how multiple methods can reveal the conditions and pathways that truly drive outcomes.
Team Remesh
September 9, 2026
.png)

The strongest driver in your survey may not be a lever you can pull.
Key driver analysis is one of the most common ways organizations make sense of survey data. Once the overall scores and demographic cuts have been reviewed, the natural next question is what matters most. Which parts of the employee experience are most closely connected to engagement, intent to stay, confidence in leadership, customer focus, or another outcome the organization cares about? Key driver analysis is meant to answer that question. It examines the relationships between a selected outcome and a set of possible explanatory factors, then helps researchers identify where attention may have the greatest payoff.
Most organizations approach the analysis through correlations, regression, or a related form of relative importance analysis. The output usually identifies a manageable set of priorities: leadership, communication, role clarity, recognition, or whichever factors show the strongest relationships with the outcome. That is a meaningful improvement over managing to the lowest survey scores. A low score may describe a problem without explaining whether it is connected to the outcome leaders want to change. Key driver analysis brings that connection into view.
The conventional approach also carries assumptions that are easy to overlook. Each potential driver is evaluated in terms of its average relationship with the outcome. Regression goes further by estimating the contribution of each variable while holding the others constant. Yet organizations do not hold everything else constant. Leadership is experienced through processes, decisions, routines, and local relationships. Empowerment depends partly on whether people can act without penalty and whether someone responds when they speak. The effect of one condition may change depending on what surrounds it.
A multimethod approach addresses that gap by asking several precise questions of the same evidence. Correlation shows which experiences move with the outcome. Regression separates unique contribution from shared variance. A predictive model tests whether nonlinearities or interactions materially alter the picture. Qualitative Comparative Analysis, or QCA, examines the combinations of conditions associated with the outcome and whether several pathways can produce it. The value comes from integration: researchers can distinguish a stable finding from one that appears only because of the assumptions built into a particular method.
The Remesh Rapid Research Lab
The case for multiple methods is straightforward; fitting them into a normal research timetable is not. Each method requires data preparation, analytical choices, quality checks, and interpretation. Research teams working against a reporting deadline often select one established technique and stop when it yields a defensible answer. The tradeoff is rarely rigor versus carelessness. It is usually analytical breadth versus the time and budget available to produce an answer while the decision is still live.
The Remesh Rapid Research Lab is designed to remove that constraint. Its purpose is to generate powerful insights rapidly by applying AI-powered computational analysis to the same research problem from several directions. Correlation, regression, machine learning, QCA, network analysis, and interpretive approaches can be run within a coordinated workflow, then compared and integrated. AI supplies computational breadth and speed. Researchers remain responsible for the decisions that determine whether the work is meaningful: how the outcome is defined, which variables belong in the analysis, how QCA sets are calibrated, whether a pattern is credible, and what it means in the organizational context.
That speed changes what is practical within a single study. Triangulation no longer has to wait for a second phase or a larger budget. If regression produces a surprising coefficient, the team can examine whether shared variance explains it, whether a nonlinear model confirms it, and whether QCA reveals configurations hidden by the average effect. Agreement across methods strengthens the inference. Disagreement is equally useful because it shows where the result depends on a model's assumptions. The Rapid Research Lab makes this diagnostic loop possible while the business question is still active.
What conventional key driver analysis can tell us
Most conventional key driver analyses are built around net effects. They estimate the relationship between each potential driver and the selected outcome while accounting for the other variables in the model. This is an important advance over simple correlation. Survey measures often overlap, and a variable that appears strongly related to an outcome on its own may contribute relatively little once that overlap is considered.
The model is doing exactly what it was designed to do: estimate which variables make the strongest independent contribution on average. The risk arises when that answer is treated as a complete account of how the organization works. Employee empowerment may build confidence when leaders respond constructively to concerns, yet create frustration when speaking up changes nothing. Clear processes may reinforce confidence in a learning culture and preserve outdated practices in a defensive one. In both examples, the surrounding conditions change the meaning and value of the apparent driver.
Traditional key driver analysis therefore remains the right foundation when the question concerns average relationships and unique contribution. It becomes incomplete when the decision depends on context: whether a weak driver becomes important above a threshold, whether two conditions amplify each other, or whether different groups reach the same outcome through different strengths. The case that follows shows what changes when those questions are examined together.
What the traditional methods revealed
We applied this logic to an anonymized study of quality culture in a global industrial organization. The 1,307 participants rated ten features of the quality environment, including leadership alignment, learning from quality issues, clear rules and processes, evidence-based decisions, cross-functional collaboration, accountability, customer feedback, effective routines, decision rights, and personal empowerment. The focal outcome was confidence that the organization would improve quality. This is a useful test case because confidence in improvement is unlikely to rest on a single organizational feature; employees form that judgment from the system they experience around them.
We began with correlation because it provides the clearest view of the unadjusted relationships. Senior-leader alignment had the strongest association with confidence, with a Spearman correlation of .45. Learning from quality issues followed at .42. Clear rules and processes, evidence-based decisions, and effective routines also showed meaningful relationships. Empowerment was positively related to confidence, although its bivariate association was smaller. At this stage, the evidence pointed toward a recognizable pattern: employees were more confident when they saw leaders aligned around quality and believed the organization learned from problems.
Regression then tested which of those relationships remained distinct after the overlap among the ten predictors was taken into account. Using the 827 cases with complete responses across all predictors and the outcome, the model explained approximately 35 percent of the variation in confidence. Leadership alignment remained the strongest standardized predictor, followed by organizational learning. Several other conditions retained smaller positive contributions. Accountability, however, moved close to zero. Its correlation with confidence had not been spurious; rather, much of the relationship was shared with decision rights, learning, leadership, and other features of the same quality environment. The regression model clarified which signals were distinctive and which were embedded in a broader cluster of related experiences.
We then used a random forest model as a challenge test. Unlike regression, it can capture nonlinear relationships and interactions without requiring the analyst to specify each one in advance. Leadership and learning again emerged as the strongest predictors, followed by clear rules and evidence-based decision making, while cross-validated performance was broadly comparable to the regression model. That convergence matters. Machine learning added value here by testing the stability of the conventional result, not by manufacturing a different answer for the sake of novelty.

What QCA added
QCA changes the unit of explanation. Regression estimates the independent contribution of variables across the sample. QCA treats each respondent as a case with a configuration of conditions and asks which configurations occur consistently alongside the outcome. This matters when the research question shifts from which factor is strongest on average to what needs to be present together for the outcome to occur, and whether there is more than one viable route.
QCA is especially relevant to organizational research because it represents three realities that conventional models can obscure. Outcomes can be conjunctural, meaning a condition works through the other conditions around it. They can be equifinal, meaning different combinations are associated with the same result. They can also be asymmetric: the conditions associated with confidence may differ from those associated with its absence. These are not statistical curiosities. They describe why the same leadership practice can succeed in one operating environment and fail in another, and why two business units can reach the same outcome through different strengths.
For this analysis, we selected five conditions that were theoretically relevant and also performed well in the earlier models: leadership alignment, organizational learning, clear rules and processes, evidence-based decisions, and empowerment. The QCA included 864 participants with complete responses on those conditions and confidence. In the initial truth table, agreement or strong agreement indicated that a condition was present, and somewhat or very confident indicated that the outcome was present. Calibration is a substantive decision because it defines what counts as membership in each set. These thresholds make the initial pathways easy to interpret, but a full analysis should test whether the conclusions hold under plausible alternatives.
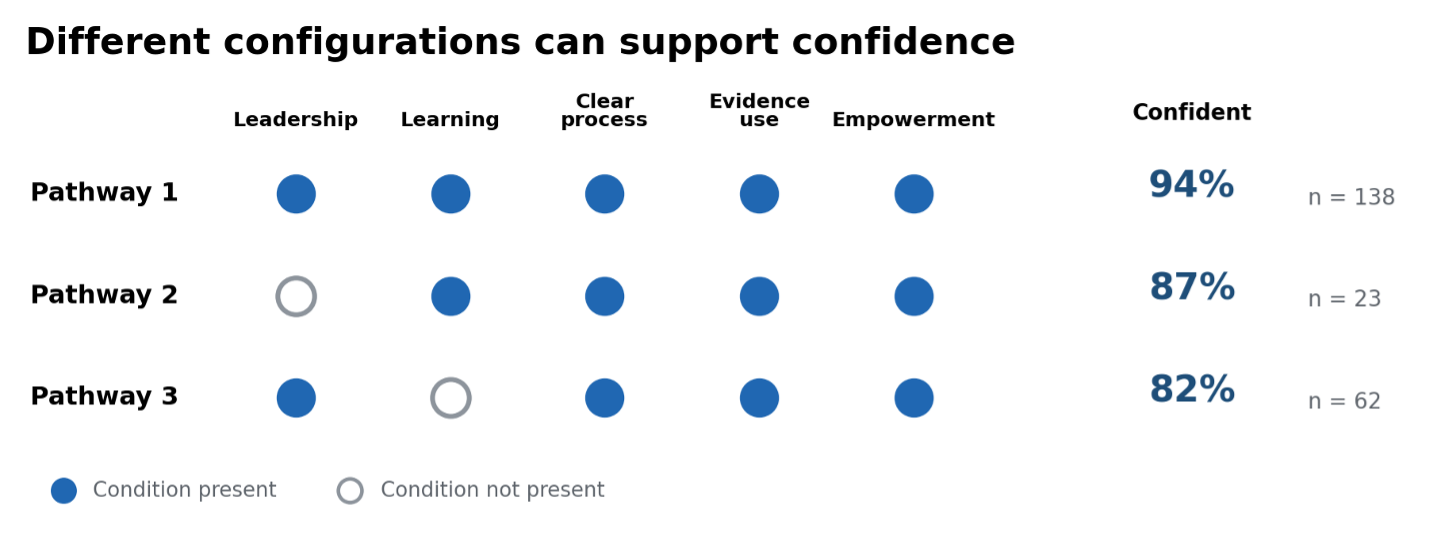
The first configuration contained all five conditions. Among the 138 employees who reported this pattern, 94 percent were confident that quality would improve. A second, smaller configuration included learning, clear processes, evidence, and empowerment without strong leadership alignment; 87 percent of those 23 employees were confident. A third configuration included leadership, clear processes, evidence, and empowerment without strong learning; 82 percent of those 62 employees were confident.
The configurations change the interpretation of the earlier models. Leadership alignment had the strongest unique average relationship with confidence, yet it was not present in every high-confidence pathway. Learning showed the same pattern. This does not make either factor unimportant; it shows that organizational strengths can partly substitute for one another when the rest of the operating environment is strong. QCA also reveals reinforcement: the highest confidence rate appeared when leadership, learning, process, evidence, and empowerment were all present. A coefficient alone cannot show either form of complexity.
From analytic priority to organizational action
Taken together, the methods point to an intervention architecture rather than a single target. Leadership alignment and learning were the most stable signals across the dataset. Clear processes and evidence use formed the operating system through which those signals became credible. Empowerment showed whether employees could participate in that system rather than merely observe it. The practical task is to strengthen the connections among these conditions, not simply to raise the score of whichever survey item carries the largest coefficient.
A leadership communication campaign, for example, would address only part of the pattern. Employees also need to see leadership priorities reflected in workable quality routines, decisions grounded in evidence, opportunities to learn quickly from failures, and credible ways to raise concerns. The QCA results also suggest that intervention should not be identical everywhere. A group with strong local routines but weaker leadership alignment presents a different problem from a group that trusts senior leaders but lacks learning and follow-through.
The evidence still has limits. These data are cross-sectional, so they cannot prove that changing one condition will cause confidence to rise. Driver is being used here in the practical survey-research sense: a factor that helps explain or predict an outcome. Agreement across methods makes the interpretation more credible, but longitudinal research and intervention testing would be needed to make stronger causal claims. QCA represents causal complexity more faithfully; it does not turn a cross-sectional survey into a causal design.
A broader standard for key driver analysis
Not every survey requires four analytical methods. The additional work earns its keep when the outcome is consequential, the predictors plausibly interact, or leaders need to understand why the same intervention may work in one setting and fail in another. Method choice should follow the decision. If average independent effects are sufficient, regression may be enough. If leaders need to understand pathways, thresholds, or local context, stopping there leaves part of the management problem unanswered.
In this study, senior leadership and organizational learning were consistently important. Confidence was highest, however, when employees experienced them within a broader quality environment that also included process clarity, evidence, and agency. More than one configuration was associated with confidence. The finding is not simply that leadership matters. It shows the conditions that tend to support leadership and the circumstances in which another pathway may be available.
Key driver analysis remains valuable because it directs attention toward the factors most closely connected to an outcome. The AI-powered workflow in the Remesh Rapid Research Lab expands the questions that can be answered within the same research cycle. Leaders can see which relationships are strongest, which survive adjustment for overlap, whether the pattern holds under a flexible predictive model, and which combinations characterize people who share the outcome. The result is evidence that is closer to the way organizations actually work: through connected conditions, multiple pathways, and context-dependent choices.
-
Lorem ipsum dolor sit amet, consectetur adipiscing elit. Suspendisse varius enim in eros elementum tristique. Duis cursus, mi quis viverra ornare, eros dolor interdum nulla, ut commodo diam libero vitae erat. Aenean faucibus nibh et justo cursus id rutrum lorem imperdiet. Nunc ut sem vitae risus tristique posuere.
-
Lorem ipsum dolor sit amet, consectetur adipiscing elit. Suspendisse varius enim in eros elementum tristique. Duis cursus, mi quis viverra ornare, eros dolor interdum nulla, ut commodo diam libero vitae erat. Aenean faucibus nibh et justo cursus id rutrum lorem imperdiet. Nunc ut sem vitae risus tristique posuere.
-
.png)
.png)
.png)


