

.png)
Advanced Research
4 Tools (and Questions) to Identify Employee Motivation and Commitment

.png)

.png)
Read Article

.png)
.png)

The Remesh Team
July 2, 2026
Employee Research
Articles
Advanced Research
4 Tools (and Questions) to Identify Employee Motivation and Commitment
Learn More
The Remesh Team
July 2, 2026
Employee Research
Articles
.png)
Advanced Research
Emotional Marketing Strategies That Boost Consumer Purchase Intent
Read Article
The Remesh Team
June 29, 2026
Market Research
Articles
Advanced Research
Emotional Marketing Strategies That Boost Consumer Purchase Intent
Learn More
The Remesh Team
June 29, 2026
Market Research
Articles

AI
Your Employees Have Feelings About AI. Most Leaders Don't Know What They Are.
Read Article
Team Remesh
June 9, 2026
Employee Research
Articles
AI
Your Employees Have Feelings About AI. Most Leaders Don't Know What They Are.
Learn More
Team Remesh
June 9, 2026
Employee Research
Articles

Trends
4 Ways To Lengthen Your Product’s Life Cycle
Read Article
Anika Nishat
June 4, 2026
Market Research
Articles
Trends
4 Ways To Lengthen Your Product’s Life Cycle
Learn More
Anika Nishat
June 4, 2026
Market Research
Articles

Research 101
Consumers Don’t Just Buy Products, They Buy Feelings
Read Article
The Remesh Research Team: Alexandra Key, Suzanne Walsh, and Frankee Thomas
May 28, 2026
Market Research
Articles
Research 101
Consumers Don’t Just Buy Products, They Buy Feelings
Learn More
The Remesh Research Team: Alexandra Key, Suzanne Walsh, and Frankee Thomas
May 28, 2026
Market Research
Articles

Building a Human-Centered Research Stack for a major beverage company
Read Article
The Remesh Team
May 26, 2026
Case Studies
Building a Human-Centered Research Stack for a major beverage company
Learn More
The Remesh Team
May 26, 2026
Case Studies
.avif)
Advanced Research
AI Tools for Market Research: How Agencies Get Faster, Deeper Insights
Read Article
Team Remesh
May 26, 2026
Articles
Advanced Research
AI Tools for Market Research: How Agencies Get Faster, Deeper Insights
Learn More
Team Remesh
May 26, 2026
Articles

.png)
How To Calculate Sample Size Using a Sample Size Formula
Learn how to calculate sample size with a margin of error using these simple sample size formulas for your market research.


What is sample size determination and why is it important
Finding an appropriate sample size, otherwise known as sample size determination, is a crucial first step in market research. Understanding why sample size is important is equally crucial. The answer: it ensures the robustness, reliability, and believability of your research findings. But how is sample size determined?
Calculating your sample size
During the course of your market research, you may be unable to reach the entire population you want to gather data about. While larger sample sizes bring you closer to a 1:1 representation of your target population, working with them can be time-consuming, expensive, and inconvenient. However, small samples risk yielding results that aren’t representative of the target population. It can be tricky because determining the ideal sample size for statistical significance ensures your research yields reliable and actionable insights.
Luckily, you can easily identify an ideal subset that represents the population and produces strong, statistically significant results that don’t gobble up all of your resources. In this article, we’ll teach you how to calculate sample size with a margin of error to identify that subset.
Five steps to finding your sample size
- Define population size or number of people
- Designate your margin of error
- Determine your confidence level
- Predict expected variance
- Finalize your sample size
What is a good statistical sample size can vary depending on your research goals. But by following these five steps, you'll ensure you get the right selection size for your research needs.
Define the size of your population
Your sample size needs will differ depending on the true population size or the total number of people you're looking to conclude on. That's why determining the minimum sample size for statistical significance is an important first step.
Defining the size of your population can be easier said than done. While there is a lot of population data available, you may be targeting a complex population or for which no reliable data currently exists.
Knowing the size of your population is more important when dealing with relatively small, easy-to-measure groups of people. If you're dealing with a larger population, take your best estimate, and roll with it.
This is the first step in a sample size formula, yielding more accurate results than a simple estimate – and accurately reflecting the population.
Designate your margin of error
Random sample errors are inevitable whenever you're using a subset of your total population. Be confident that your results are accurate by designating how much error you intend to permit: that's your margin of error.
Sometimes called a "confidence interval," a margin of error indicates how much you're willing for your sample mean to differ from your population mean. It's often expressed alongside statistics as a plus-minus (±) figure, indicating a range which you can be relatively certain about.
For example, say you take a sample proportion of your colleagues with a designated 3% margin of error and find that 65% of your office uses some form of voice recognition technology at home. If you were to ask your entire office, you could be sure that in reality, as low as 62% and as high as 68% might use some form of voice recognition technology at home.
Determine how confident you can be
Your confidence level reveals how certain you can be that the true proportion of the total population would pick an answer within a particular range. The most common confidence levels are 90%, 95%, and 99%. Researchers most often employ a 95% confidence level.
Don't confuse confidence levels for confidence intervals (i.e., mean of error). Remember the distinction by thinking about how the concepts relate to each other to sample more confidently.
In our example from the previous step, when you put confidence levels and intervals together, you can say you're 95% certain that the true percentage of your colleagues who use voice recognition technology at home is within ± three percentage points from the sample mean of 65%, or between 62% and 68%.
Your confidence level corresponds to something called a "z-score." A z-score is a value that indicates the placement of your raw score (meaning the percent of your confidence level) in any number of standard deviations below or above the population mean.
Z-scores for the most common confidence intervals are:
- 90% = 2.576
- 95% = 1.96
- 99% = 2.576
While not as commonly used, the z-score for an 80% confidence interval is approximately 1.28. If you're using a different confidence interval, use this z-score table. A z-score sample calculator like this will quickly determine the appropriate value for your chosen confidence level.
Predict variance by calculating standard deviation in a sample
The last thing you'll want to consider when calculating your sample size is the amount of variance you expect to see among participant responses.
The standard deviation in a sample measures how much individual sample data points deviate from the average population.
Don't know how much variance to expect? Use the standard deviation of 0.5 to make sure your group is large enough.
Finding your ideal sample size
Now that you know what goes into determining sample size, you can easily calculate sample size online. Consider using a sample size calculator to ensure accuracy. Or, calculate it the old-fashioned way: by hand.
Below, find two sample size calculations - one for the known population proportion and one for the unknown population.
Sample size for known population
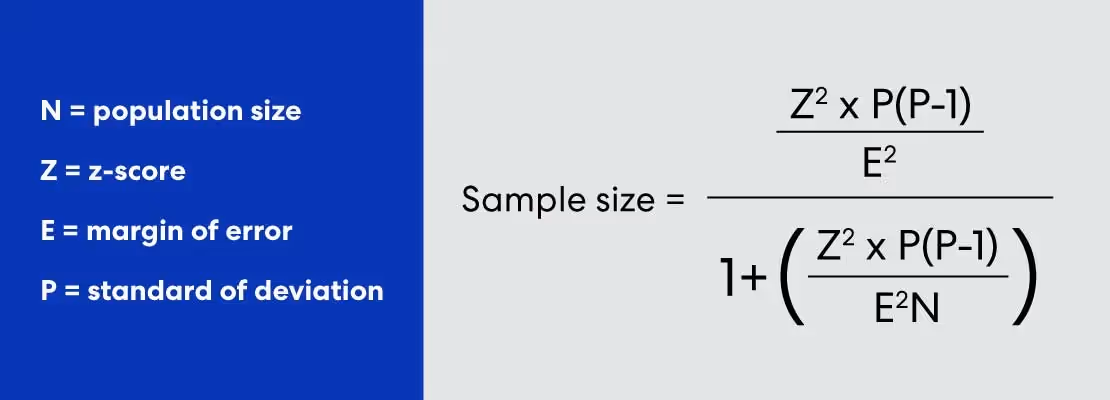
Sample size for unknown population
.avif)
Here’s how the calculations work out for our voice recognition technology example in an office of 500 people, with a 95% confidence level and 5% margin of error:
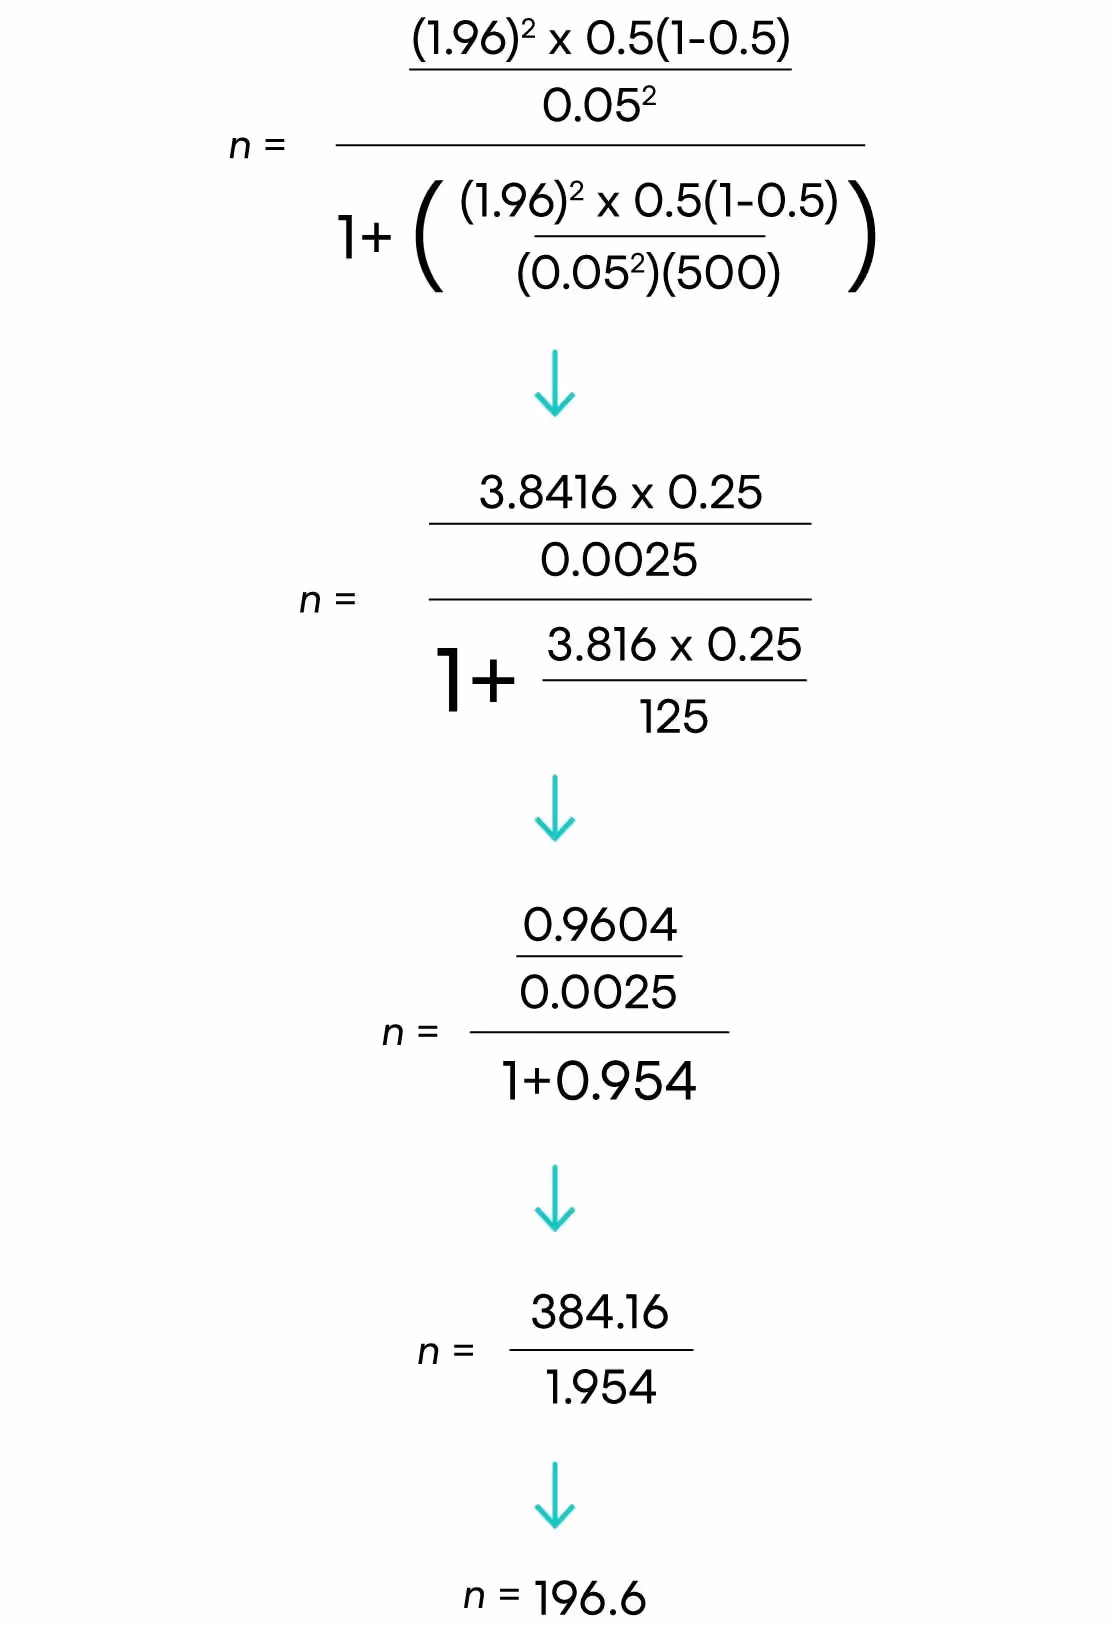
There you have it! 197 respondents are needed.
You can tweak some things if that number is too big to swallow.
Try increasing your margin of error or decreasing your confidence level. This will reduce the number of respondents necessary but, unfortunately, increase the chances of errors. Even so, understanding why trade-offs are necessary in sample size determination can help you make informed decisions.
Summing Up Sample Size
Calculating sample size sounds complicated - but, utilizing an easy sample size formula and even calculators are now available to make this tedious part of market research faster!
Once you've determined your sample size, you're ready to create and distribute your sample market research survey. This can be done through methods like running a focus group or even a customer satisfaction survey. Whatever you decide, you now have the information needed to make decisions with confidence.
Want to whip your research skills into shape? Check out our go-to eBook on writing discussion guides!
-
Lorem ipsum dolor sit amet, consectetur adipiscing elit. Suspendisse varius enim in eros elementum tristique. Duis cursus, mi quis viverra ornare, eros dolor interdum nulla, ut commodo diam libero vitae erat. Aenean faucibus nibh et justo cursus id rutrum lorem imperdiet. Nunc ut sem vitae risus tristique posuere.
-
More
Stay up-to date.
Stay ahead of the curve. Get it all. Or get what suits you. Our 101 material is great if you’re used to working with an agency. Are you a seasoned pro? Sign up to receive just our advanced materials.