

Advanced Research
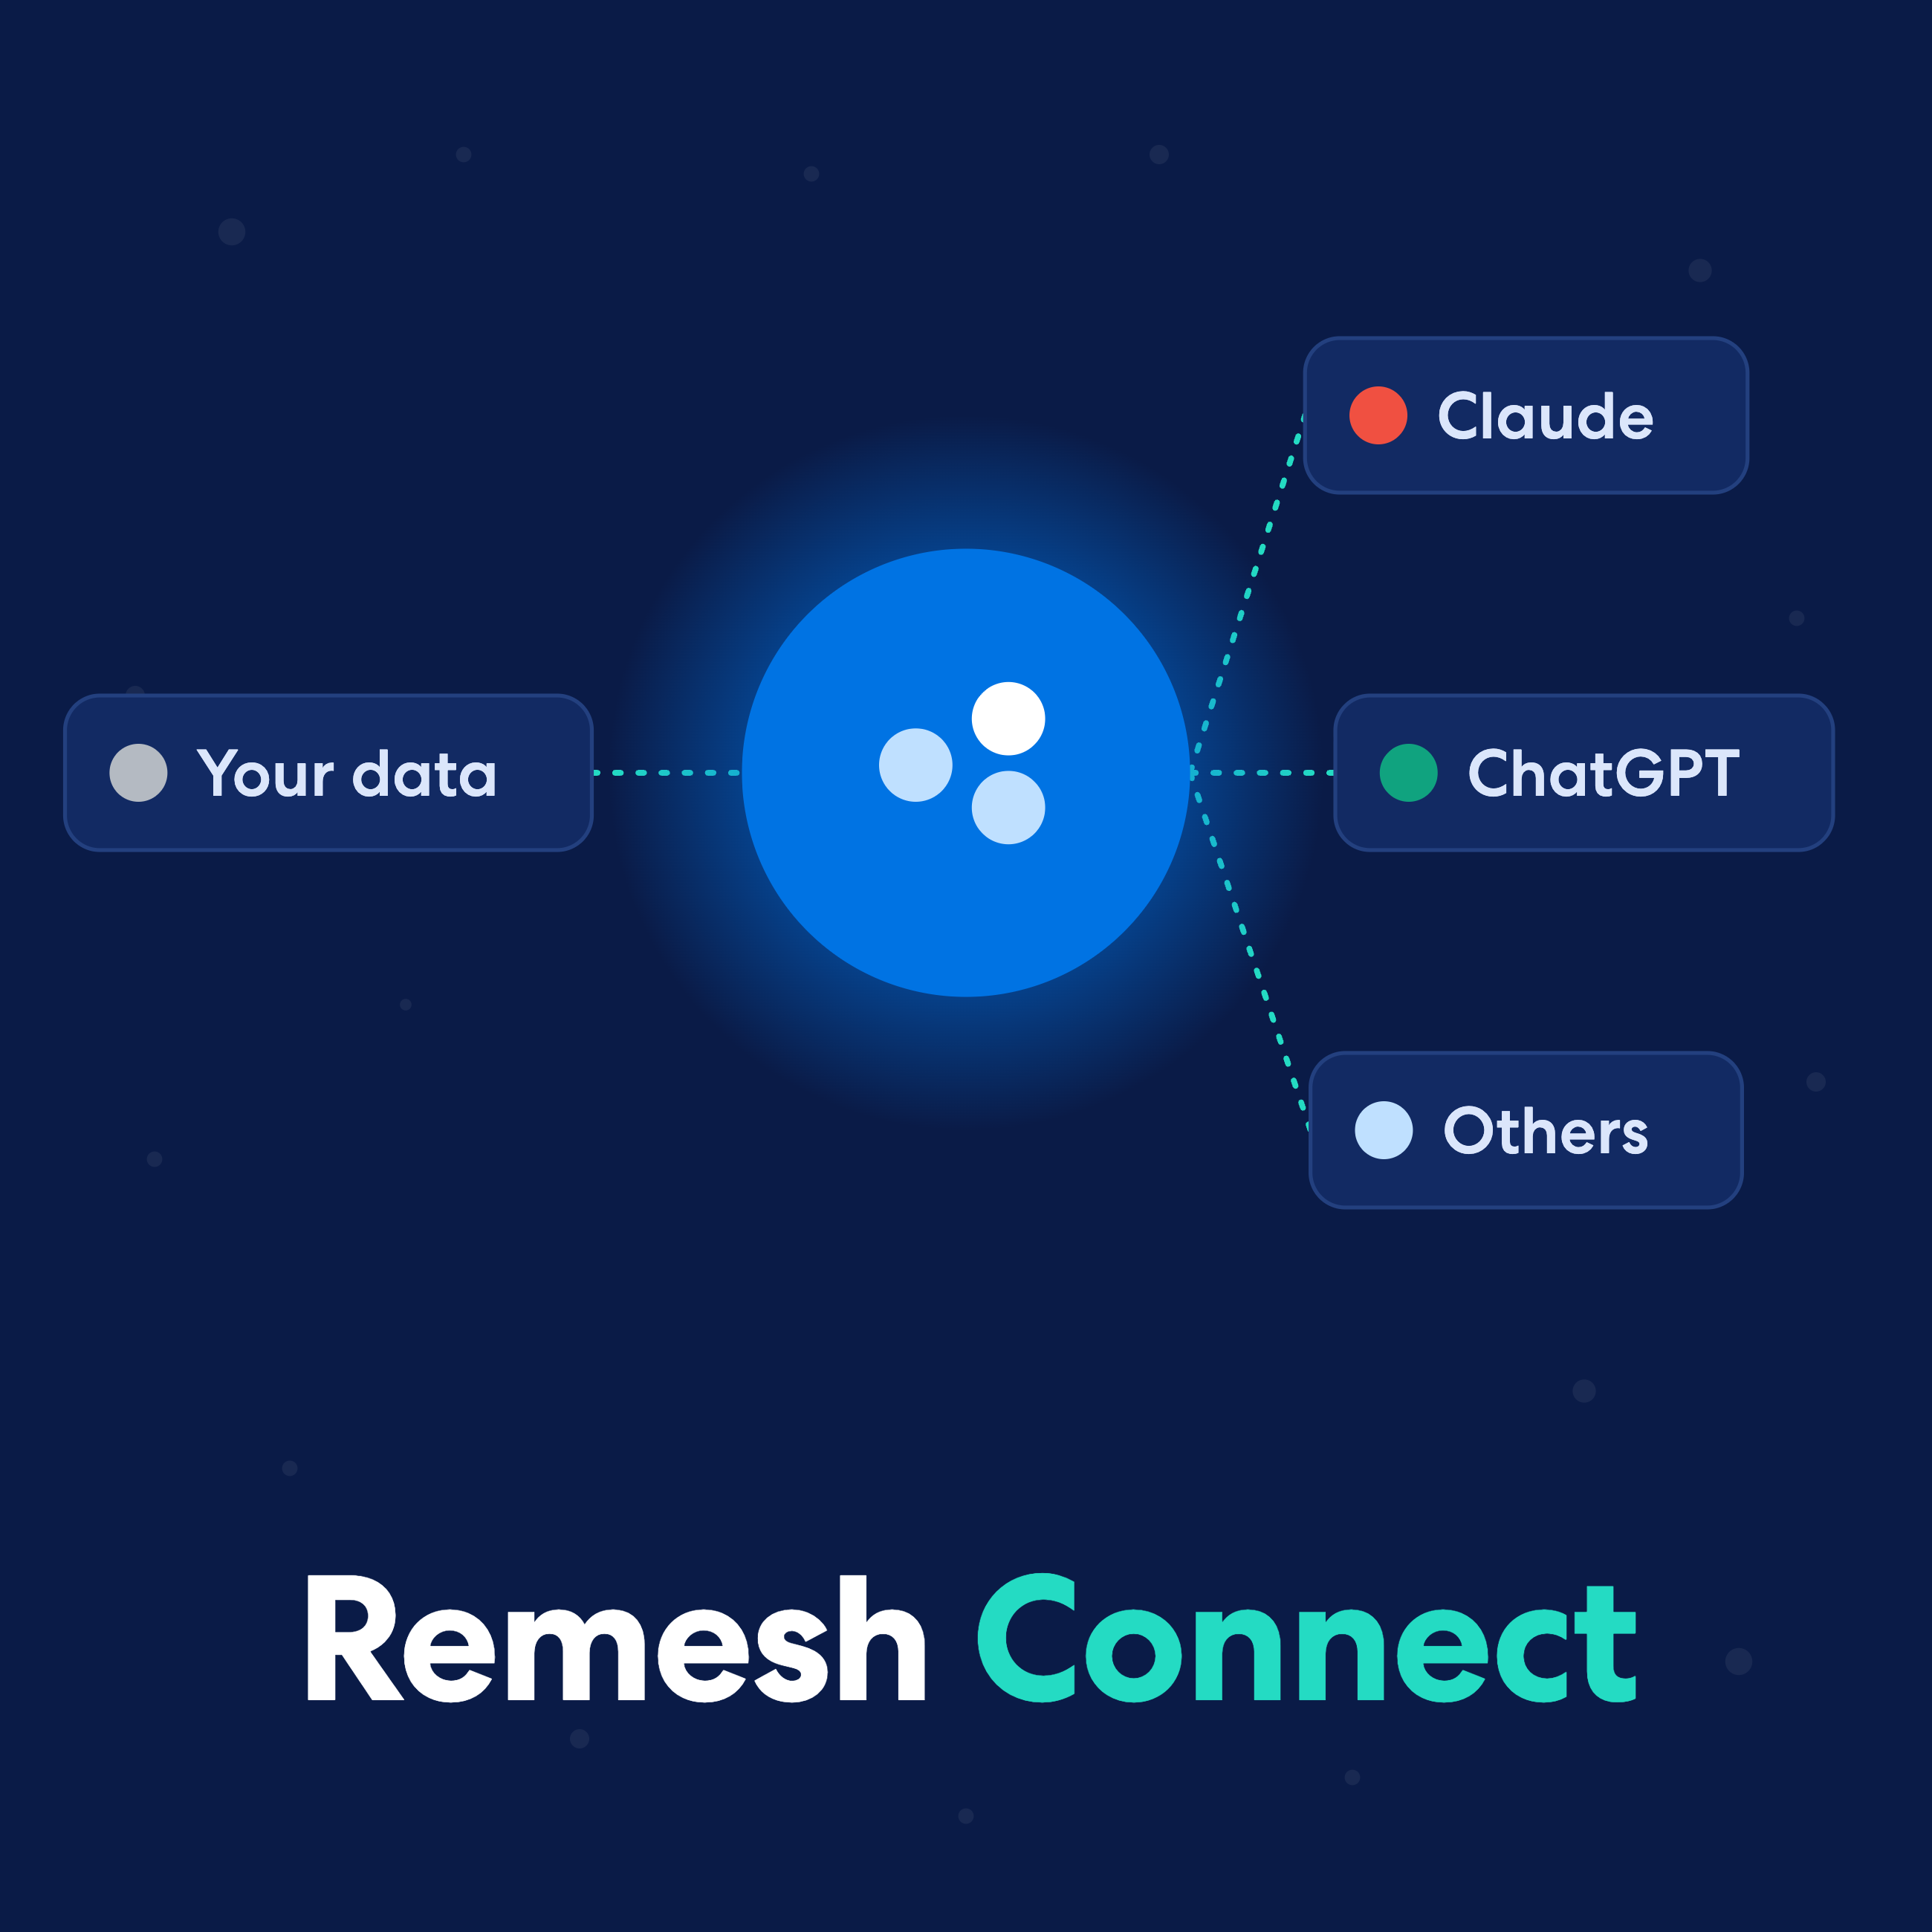
Remesh Connect: Bring Your Data and Remy Wherever You Work

.png)

.png)
Read Article

.png)
.png)

Team Remesh
July 14, 2026
Market Research
Articles
Advanced Research
Remesh Connect: Bring Your Data and Remy Wherever You Work
Learn More
Team Remesh
July 14, 2026
Market Research
Articles
.png)
Advanced Research
4 Tools (and Questions) to Identify Employee Motivation and Commitment
Read Article
Team Remesh
July 2, 2026
Employee Research
Articles
Advanced Research
4 Tools (and Questions) to Identify Employee Motivation and Commitment
Learn More
Team Remesh
July 2, 2026
Employee Research
Articles
.png)
Advanced Research
Emotional Marketing Strategies That Boost Consumer Purchase Intent
Read Article
The Remesh Team
June 29, 2026
Market Research
Articles
Advanced Research
Emotional Marketing Strategies That Boost Consumer Purchase Intent
Learn More
The Remesh Team
June 29, 2026
Market Research
Articles

AI
Your Employees Have Feelings About AI. Most Leaders Don't Know What They Are.
Read Article
Team Remesh
June 9, 2026
Employee Research
Articles
AI
Your Employees Have Feelings About AI. Most Leaders Don't Know What They Are.
Learn More
Team Remesh
June 9, 2026
Employee Research
Articles

Trends
4 Ways To Lengthen Your Product’s Life Cycle
Read Article
Anika Nishat
June 4, 2026
Market Research
Articles
Trends
4 Ways To Lengthen Your Product’s Life Cycle
Learn More
Anika Nishat
June 4, 2026
Market Research
Articles

Research 101
Consumers Don’t Just Buy Products, They Buy Feelings
Read Article
The Remesh Research Team: Alexandra Key, Suzanne Walsh, and Frankee Thomas
May 28, 2026
Market Research
Articles
Research 101
Consumers Don’t Just Buy Products, They Buy Feelings
Learn More
The Remesh Research Team: Alexandra Key, Suzanne Walsh, and Frankee Thomas
May 28, 2026
Market Research
Articles

Building a Human-Centered Research Stack for a major beverage company
Read Article
The Remesh Team
May 26, 2026
Case Studies
Building a Human-Centered Research Stack for a major beverage company
Learn More
The Remesh Team
May 26, 2026
Case Studies
.avif)

Product Update: Charts and PPTX Export Come to Remy
Visualizations are now in Remy, paired with an editable PowerPoint export aimed at the bigger problem: moving evidence out of a thread and into a deck.

.png)
Visualizations are a baseline expectation for modern analysis tools. They're now in Remy, paired with an editable PowerPoint export aimed at the bigger problem: moving evidence out of a thread and into a deck.
A few weeks ago, we published what we'd learned from six months of Remy usage. The clearest finding was that evidence portability, getting insight out of a Remy thread and into the deliverable it belongs in, was our biggest unmet need. Charts were the most obvious near-term gap, and at this point in the market, a conversational research tool without inline visuals is missing table stakes.
As of today, they're in.

What's new in this release
Remy now generates charts inline with analysis answers. When a question has quantitative structure underneath (Poll results, rankings, segment breakdowns, or Auto Code themes over open-end responses), Remy picks a chart type and renders it below the text.
- Bar for distributions, rankings, and group comparisons.
- Pie for composition and proportion.
- Scatter for two-variable relationships (for example, agreement vs. mention rate).
Chart type is selected automatically based on data shape and question intent. You can override ("show a pie chart of brand preference") and Remy will accommodate if the data supports it. Visuals respect citations, crosstabs, and segment filtering, so the lenses you were already using apply.
Charts are not limited to Poll data. Remy can represent Ask responses through frames like Auto Code themes, showing theme composition and the number of responses aligned to each. Remy can chart these quantitative representations of qualitative data.
The export is the bigger story
Inline charts are the visible headline. The piece we care more about is the "Download Charts" button that appears below any answer with a visual.
It doesn't export an image. It exports a native, editable PowerPoint file with Excel-backed data tables. Right-click in PowerPoint to edit data, change colors, relabel axes, or swap chart types. Multiple charts in a single answer become separate slides in one PPTX, and each answer block has its own export.
That is the part that closes the thread-to-deck gap. A proof point surfaced in Remy now lives inside your deliverable in the format a stakeholder will actually see, without a screenshot workflow and without losing the underlying data.
Getting more out of it
- Ask for breakdowns directly. "Show the breakdown of responses for Q3" is more likely to produce a chart than "what do people think about Q3."
- Set the lens before the visual. Apply segment filters and crosstabs first, then ask for the chart.
- Treat the PPTX as a draft. Editing labels and colors in PowerPoint is often faster than re-prompting.
-
Where this fits
Charts are one piece of a broader push: making Remy's outputs portable to the places researchers actually present and defend their work. A chart in a thread is an artifact. A chart in a deck is an argument. What we're building toward is a workflow where the thread and the deliverable stop being separate problems.
Want to see Remy in action? Take Remy for a spin, or request a demo to see how Remy fits into your research workflow.
-
Lorem ipsum dolor sit amet, consectetur adipiscing elit. Suspendisse varius enim in eros elementum tristique. Duis cursus, mi quis viverra ornare, eros dolor interdum nulla, ut commodo diam libero vitae erat. Aenean faucibus nibh et justo cursus id rutrum lorem imperdiet. Nunc ut sem vitae risus tristique posuere.
-
More
Stay up-to date.
Stay ahead of the curve. Get it all. Or get what suits you. Our 101 material is great if you’re used to working with an agency. Are you a seasoned pro? Sign up to receive just our advanced materials.